ECE 462 Final Project

Techniques
Below are some of the methods and techniques used and measured in this project
Ultrasound Processing
Most diagnostic medical ultrasound devices use ultrasound waves at a frequency of around 1-15MHz. From there the already transmitted waves propagate throughout the tissue where then the structures are reflected and return as wave echoes. But how exactly does this process occur? As we can see from the block diagram, each diagnostic device performs this method as the digital signals process the ultrasound waves.

Simplified Block Diagram of an Ultrasound Diagnostic Device
The image above shows in simple steps how these waves begin processing. Once the initial echo signals are amplified and filtered through an analog chain, they are then digitally processed using an ADC or an Analog-Digital-Converter. The signals end up being converted at an 8 - 14-bit resolution. From there, there are two pieces of information that can be extrapolated. The high-frequency signal of the echoes also referred to as a Radio Frequency signal, is recorded as the amplitude of the wave. As well as the phase-modulated carrier frequency signal. Moving on the signal is demodulated to obtain the baseband frequency. From then finally, the now demodulated signal can be further processed and manipulated given the needed situation and application.
Quadrature Demodulation
Quadrature Demodulation is often referenced at the forefront of Ultrasound Imaging, in which it is used to break down existing signals to obtain them at their purest form. To even begin with the Demodulation, however, we first need to break down its fundamental components. These can be seen in three steps. The Dow-Mixing, Low-Pass Filtering, and finally the Decimation.
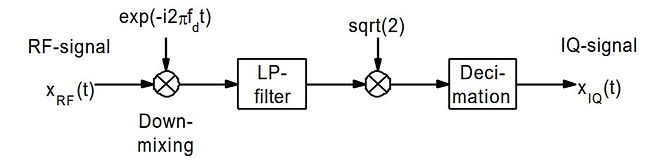
Quadrature Demodulation
With Down-Mixing, the real-valued RF signal is multiplied by a complex sinusoidal signal. Using the following equation:
Where t is the time along the beam and r, the relationship between time and distance t = 2*r/c where c is the velocity of human tissue at 1540m/s, leaving the end signal complex

Down Mixing Plot
After the Down-Mixing comes the Low Pass FIltering, which low filters the complex signal in order to remove the negative frequency spectrum and any unwanted noise left outside the desired bandwidth. If done well the signal will become weak for any frequencies outside the pass-band.
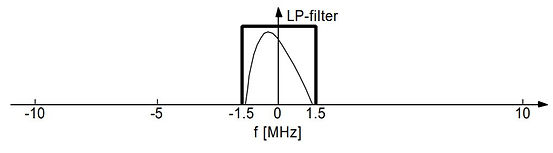
Low-Pass Filter Plot
The final step in this breakdown is the Decimation. As the name suggests this part greatly reduces the sampling frequency. This is made possible by the Nyquist theorem which states that the sampling frequency can be reduced to twice the cutoff frequency of a filter without a loss of information.

Deduction Plot via Sampling rate